As a Farm Management Support (FMS) Specialist for Lely Center Mid-Atlantic, I analyze feed tables and associated graphs for our farms. When I began the FMS duties, I was surprised by how many farms said they rarely look at their feed tables. I think a lot of farms don’t feel comfortable with the tables or completely understand how they work, so they avoid them altogether. If that sounds like you, don’t be afraid to reach out to your local FMS Specialist and your nutritionist to form a partnership. It should be noted that all farms are different, and it’s not easy to make sweeping statements about nutrition. However, there some guidelines you can follow.
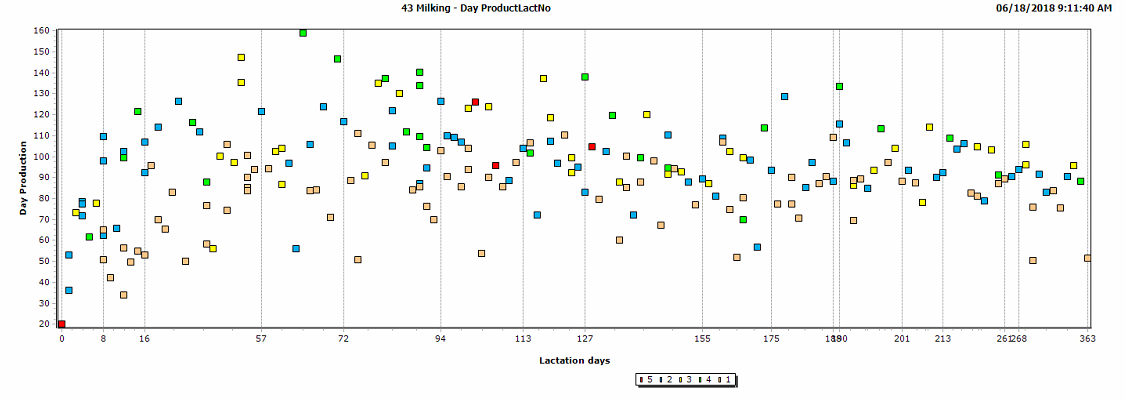
All our farms have this specialty graph called 43.p. Milking-Day Production. The graph shows lactation days on the X-axis and Day Production on the Y-axis. Each cow is a dot on the graph, colored by lactation number. You can hover your cursor over each dot to see the cow number, exact lactation days and day production, and you can click on the dot to go to the cow card.
When you look at this graph regarding the feeding program, look for lactation curves with strong peaks and persistency. It is important to know when the feed tables transition to the second tier and to make sure there are no major drops in production after it does so. Next, look for any trends in the herd and make sure there are no ceilings, or levels of production where it seems like the cows can’t overcome. Ceilings can be caused by uneven increments in the daily rate of gain on the feed table. For example, you may feed an increase of four pounds of pellet from 60 pounds of milk to 70 pounds of milk, but by the time you reach the transition of 90 to 100 pounds of milk, the rate of gain may decrease to two pounds. This could cause a ceiling because the additional milk is not supported by enough energy in the robot. The last thing to check on this graph is the production of the highest cow and highest first lactation heifer. Often times when farms first make the feed table, they’ve never had a cow hit a certain level of production and therefore they don’t include it on the table. It is not unusual to have cows and heifers hit higher peaks in the robot than in the previous milking system, so you want to make sure that your feed table supports the new increased peaks.
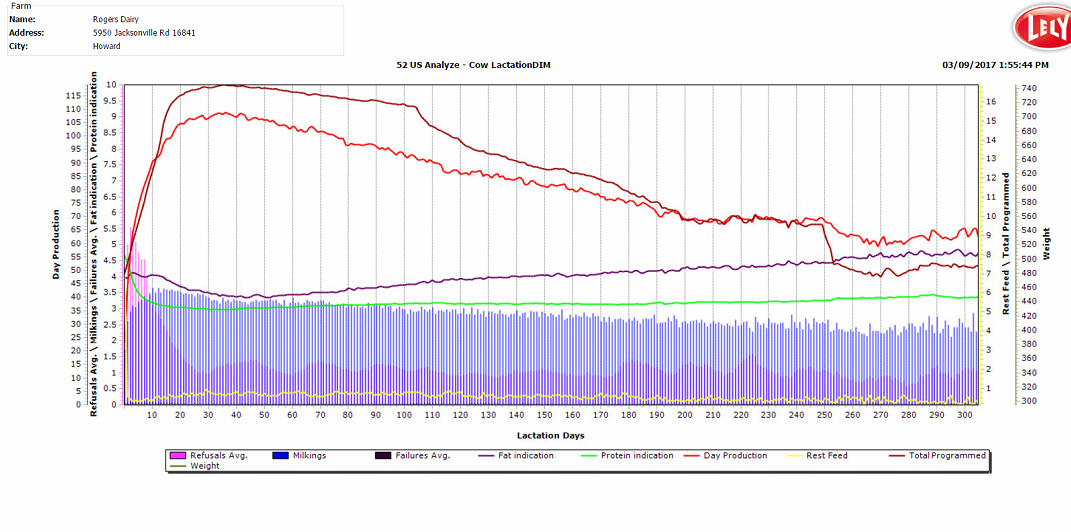
The second graph which illustrates the impacts of the feed table is 52 US Analyze- Cow Lactation DIM. For today’s purpose, the most important thing to identify is the interaction between the red “Day Production” line and the brown “Total Programmed” (robot pellet) line. For this farm, you can see they are feeding the ramp up period until about 20 days in milk. You can tell this by looking at the line and seeing it has a fixed slope, indicating all cows are getting fed the same. After 20 days, the line becomes more variable in slope, indicating that the cows are now getting fed for their level of production. You want to see a smooth transition with solid peak and persistency, and most importantly, no drop in production at the transition. Along the same lines, you can see the brown Total Programmed line decrease at 100 days in milk. This is when cows transition to the second tier of the feed table and are no longer getting led fed. Look to make sure you are not seeing this correlate with significant drops in production.
Once you have reviewed various graphs and reports to get an understanding of how your herd is transitioning and performing through their lactation, you can move on to looking at the feed table itself.
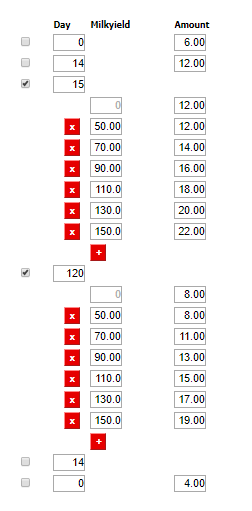
There are a few basic checks to do when looking at the table. The first is to make sure that cows are not getting feed taken away when they transition from the ramp up period to getting fed based on their production. On this example feed table, you can see the cows producing anything less than 50 pounds of milk stay at 12 pounds of pellet. Lely recommends not pulling away energy in early lactation because if any animals are off to a slow start pulling more energy away is likely going to make matters worse. We want to give every animal the chance to succeed. The first tier of the table is typically pushing the cows to produce by lead feeding. Most tables transition anywhere from 90-120 days in milk at which point they pull some pellet away, save on feed costs, and only feed for the cow’s energy needs. Once again, double check the table to make sure you are feeding even increments in rate of gain. Lastly, two weeks before cows get dried off they typically get somewhere around 4 pounds of pellet to cut them back before dry-off. Note, T4C counts days until dry off using days pregnant, so you must be labeling your cows as pregnant in order to have them receive this benefit in T4C. Lely recommends not feeding less than 4 pounds of pellet simply to have enough feed at each visit.
The last quick check you can do on your feed table is to click on the “Graph” tab and see how the average cow in the herd is getting fed.
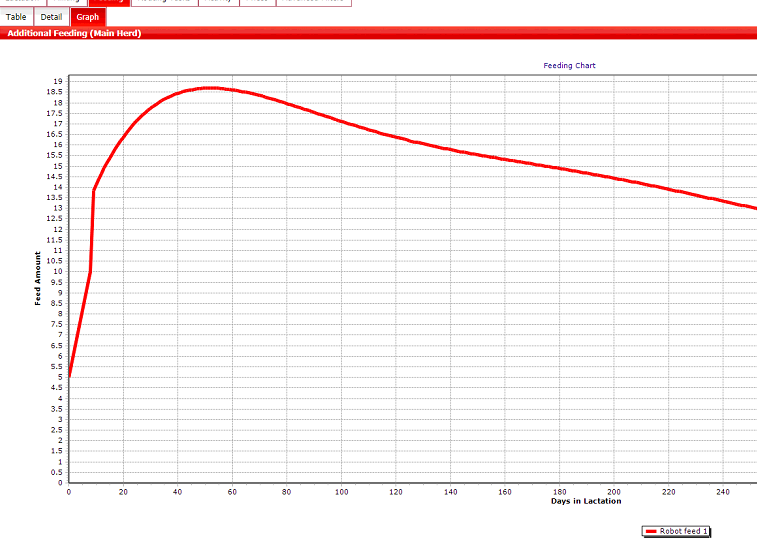
When you view this graph, once again make sure the transition is smooth as the cows go through lactation. This curve should look similar to a lactation curve with no harsh drops. Check the increase in pellet once they begin to get fed off milk yield and make sure they are not increasing too significantly, which would look like a vertical line. If you see this dramatic increase it could signify that you are holding your cows back during the ramp up period.
To summarize:
- Look for general herd trends and try to spot any potential risks, such as a ceiling, on the 43P graph. Make sure you are feeding for your highest producing cow and first lactation heifer.
- On 52 US Analyze Cow Lactation DIM, analyze the interaction between the Day Production and Total Programmed lines. Look for smooth transitions with no harsh drops.
- Make sure there are even rates of gain on the feed table, with no drop in pellet between the ramp up period and getting fed based off of milk production. Avoid feeding less than four pounds of pellet anywhere on the table.
- Use the graph tab on the feed table to see the average cows programmed pellet based off of your current feed table. Once again, the goal is to see no drastic increases or decreases. A vertical line at the first transition after the ramp up period could mean the cows are getting held back. A big drop at the second tier of the feed table could mean we are taking too much feed away.
- Most importantly, utilize your local Farm Management Support Specialist, your regional Lely representatives, and your nutritionist, all of whom are happy to team up with the goal of helping you increase your herds productivity and health.